ROUND-TRIP TIME (RTT) – Understanding Network and Security for Near-Edge Computing
Also known as latency, this represents the amount of time in milliseconds that a packet takes to travel from sender to receiver and back again.
Assuming the path between the sender and the receiver is a straight line, there is no way to reduce RTT because it is limited by the speed of light. The speed of light is fast, but finite – for every 100 km (60 miles) of distance a signal travels, 1 millisecond is added to its RTT.
Maximum segment size (MSS)
MSS is the maximum number of bytes that may be contained in the payload section of a TCP segment.
To calculate the appropriate MSS value, you must take the standard Maximum Transmission Unit (MTU) of 1,5001 and subtract any overhead involved.
1 The path MTU over the internet is almost always 1,500 bytes.
Here is an example
Layer 4: TCP header of 32 bytes2
2 TCP headers are 20 bytes natively, but these days, it is a safe assumption that TCP timestamps are in use, which raise the value to 32 bytes.
Layer 3: IP header of 20 bytes
Layer 3: 78 bytes overhead if an IPSEC VPN tunnel is being used
In this example, the MSS value would be 1,500 – 32 -20 -73 = 1,375 bytes
The MSS value is set in the receiver’s operating system. That value is announced by the receiver during the TCP three-way handshake, telling the sender it is the largest payload it can accept. This can be restricted to a desired value by a stateful device in the middle, such as a firewall or load balancer, via MSS clamping.
Mathis equation
The maximum throughput that can be achieved by a TCP connection can be calculated as follows:

Here, we have the following:
t is the effective throughput in bits per second
m is the MSS value in bits
r is the RTT value in milliseconds
p is the percent packet loss as a decimal number
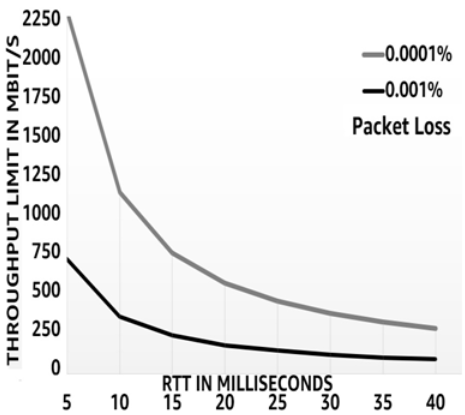
Figure 2.2 below illustrates how the interaction of RTT and packet loss affects the effective throughput of a connection. The lighter line shows a loss of one packet in a million, while the darker line shows a loss of one in a hundred thousand.

Figure 2.2 – Effective throughput estimated by the Mathis equation
Figure 2.2 illustrates how the interaction of RTT and packet loss affects the effective throughput of a connection. The lighter line shows a loss of one packet in a million, while the darker line shows a loss of one in a hundred thousand. Remember, under these conditions, it does not matter how fast your internet connection is – these are hard limits. As you can see, it doesn’t take much packet loss to severely curtail an end user’s experience.
You may also like
Archives
- August 2024
- July 2024
- June 2024
- May 2024
- April 2024
- March 2024
- February 2024
- January 2024
- December 2023
- November 2023
- October 2023
- September 2023
- August 2023
- July 2023
- May 2023
- April 2023
- February 2023
- January 2023
- November 2022
- October 2022
- September 2022
- August 2022
- July 2022
- June 2022
- May 2022
- April 2022
- December 2021
- November 2021
- October 2021
- September 2021
- June 2021
Calendar
| M | T | W | T | F | S | S |
|---|---|---|---|---|---|---|
| 1 | 2 | |||||
| 3 | 4 | 5 | 6 | 7 | 8 | 9 |
| 10 | 11 | 12 | 13 | 14 | 15 | 16 |
| 17 | 18 | 19 | 20 | 21 | 22 | 23 |
| 24 | 25 | 26 | 27 | 28 | 29 | 30 |
| 31 | ||||||
Leave a Reply